Experiment Management
Introduction
To access the experiment information, switch to the DEVELOP Tab in the navigation bar.
trail work with the open source experiment tracker MLFlow. Don't worry if you have never worked with MLflow the necessary basics are explained in the next section.
For a more thourough read we recommend the official documentation as a good starting point.
Before the first experiment
Go to the webapp and create a new project (see AI Registry for more information).
Run two commands in your CLI:
pip install trailmltrail init
The trail helper will guide you through the process of creating your config file, which will look like this:
endpointUrl: ''
email: <YOUR_USERNAME>
apiKey: null
projects:
  id: 1234ABC
  parentExperimentId: ABCD123
Start with providing your email and apiKey. You can find your api key in the webapp under the profile tab.
The endpointUrl is only important if you want to log experiments to an individual deployment, otherwise leave it empty. Get in touch with the trail team if you are unsure about your endpointUrl.
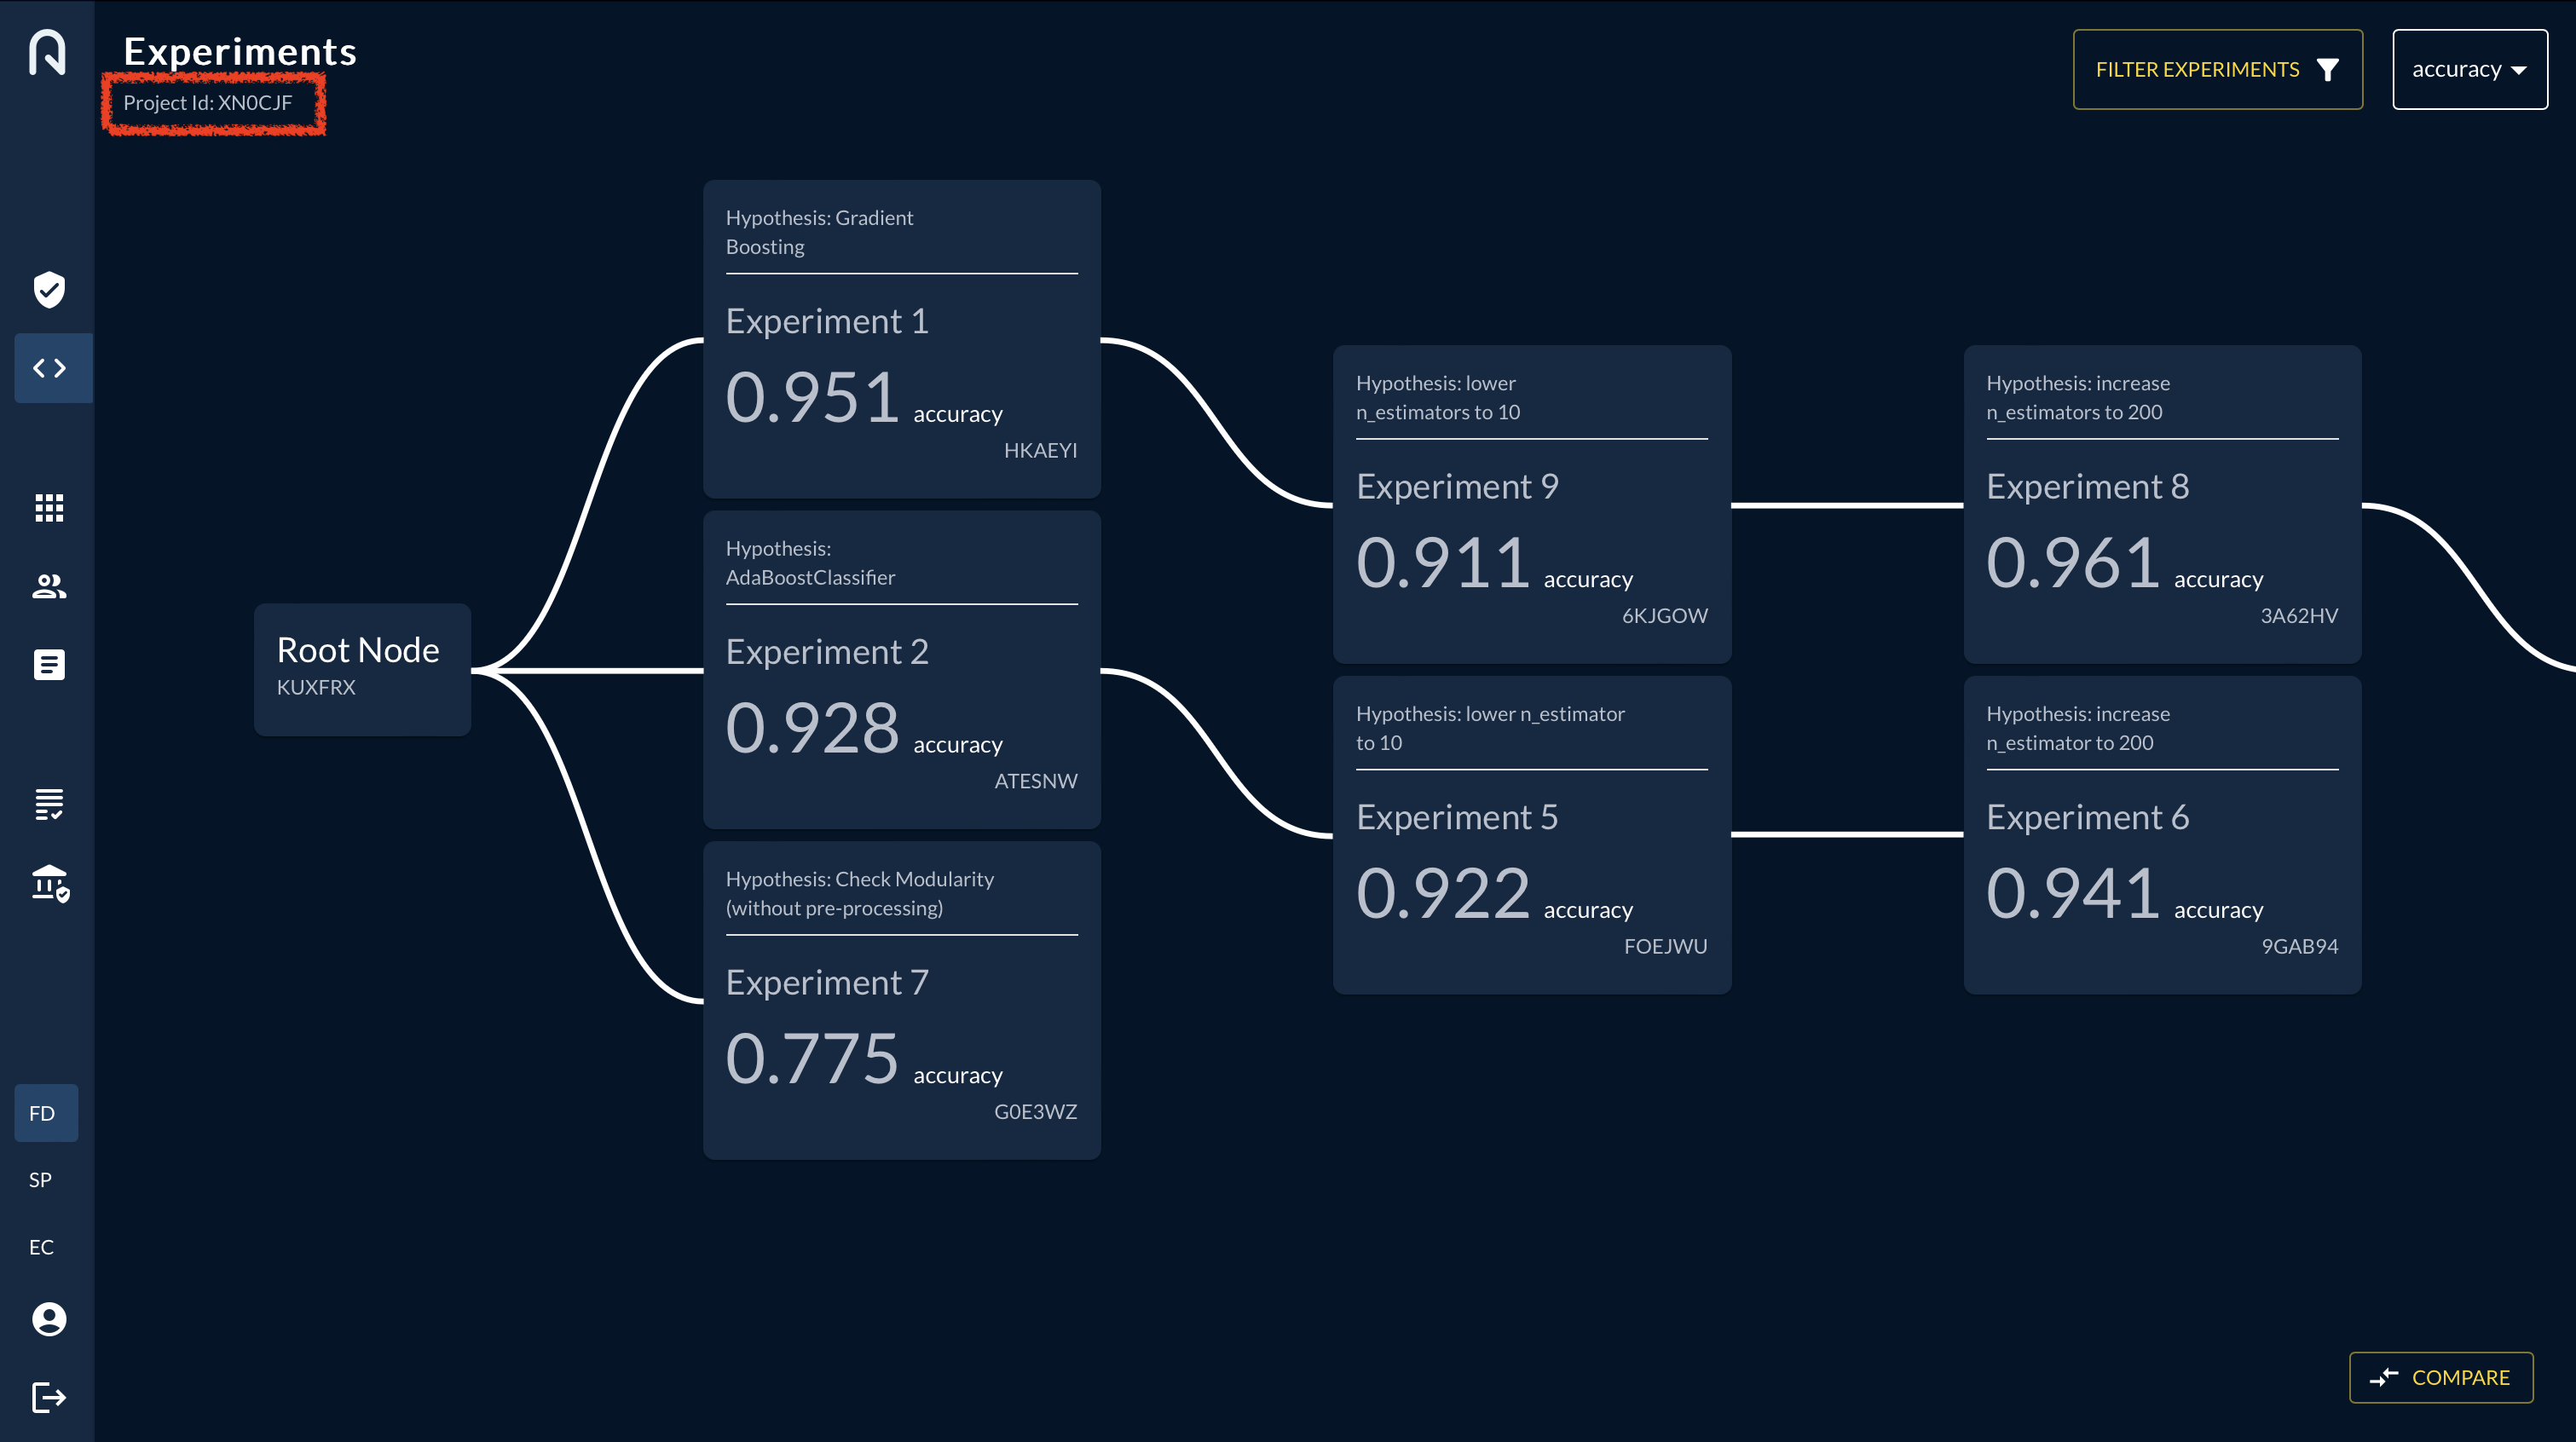
For the project information: You can find the ìd in the web app experiment view in the top left after you have created a new project in the project view, and selected that project in the top right of the experiment view:
The parentExperimentId can be found in bottom ot the root-node or the bottom-right of any other node. Depending on which node you choose as a parent node, the new experiment will be a child of that node.
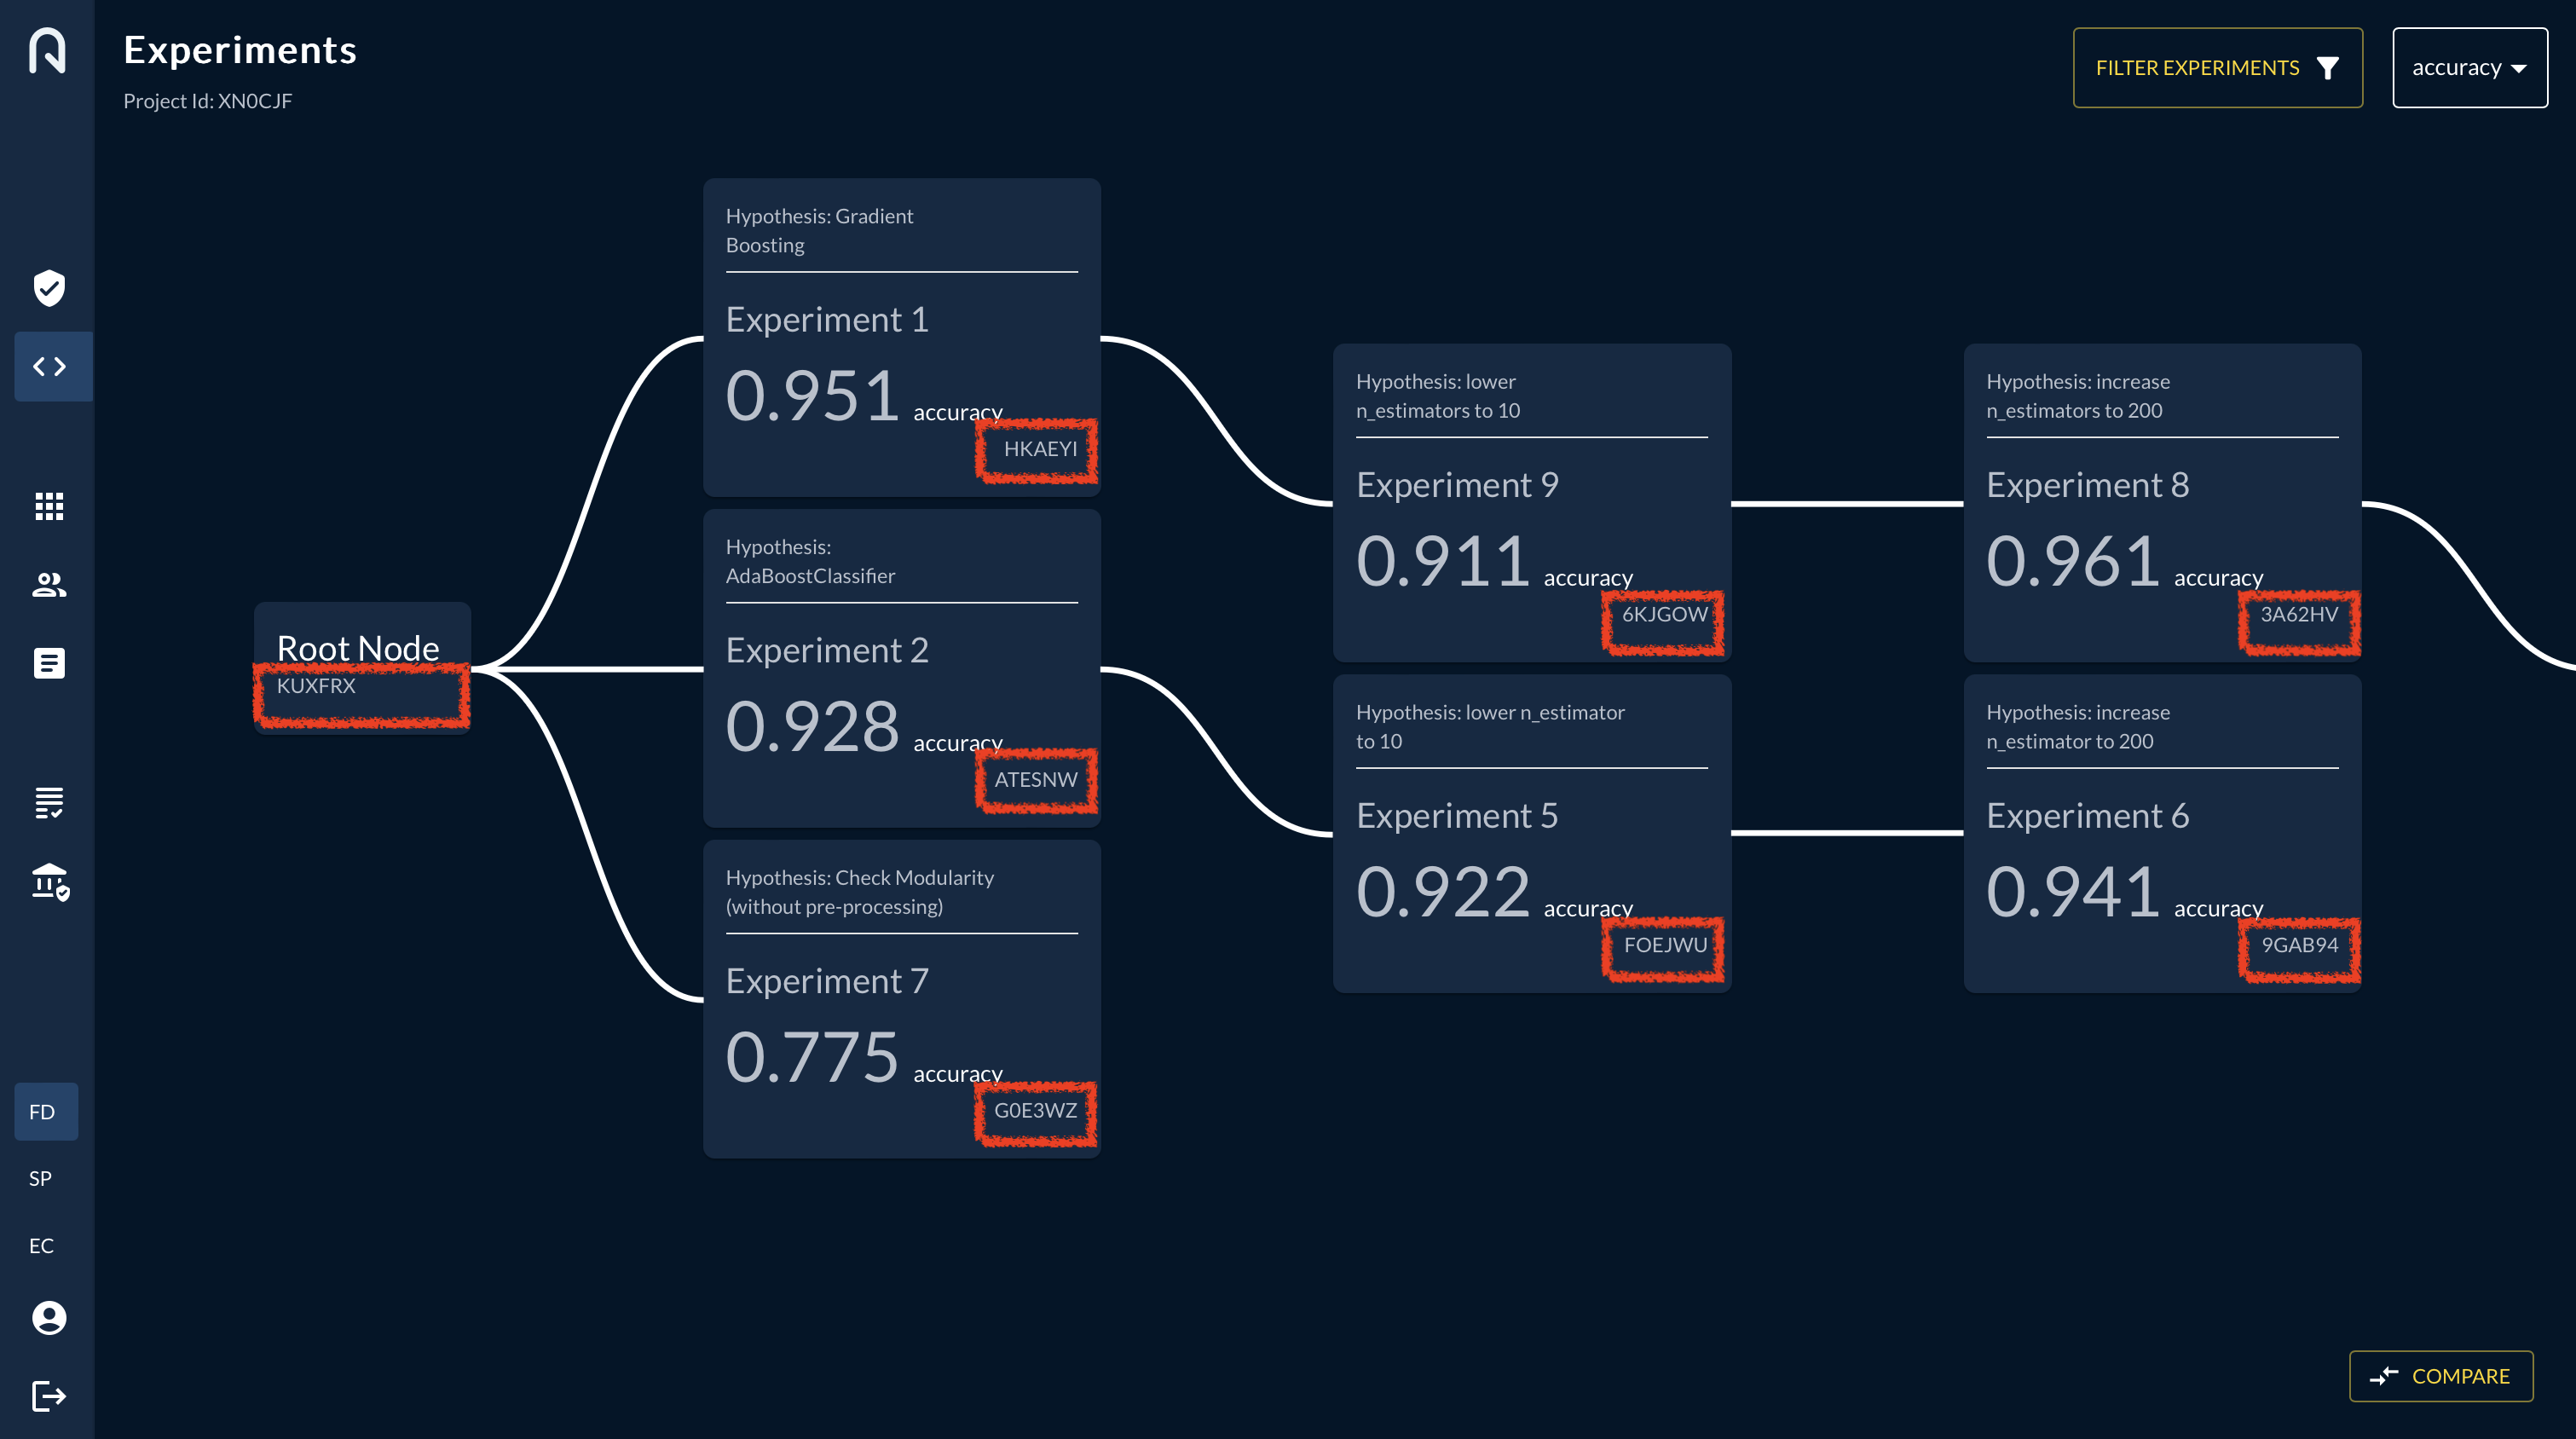
The parentID will get updated automatically after every run. You only have to update the parentID if you want to open up a new branch in the tree.
E.g. if you want to start a new branch from the root node, you have to update the parentID to the root node ID.
Alternatively you can create a trailconfig.yaml file manually, save it in your project directory and fill in your email, apiKey, id and parentExperimentId as described above.
How to prepare your code
-
Import mlflow and trail
-
Start a run and wrap your code with the trail context manager.
Now every metric, parameter and artifact that you logged with mlflow will be tracked in the trail app.
Available functions
If you want to add further information to an experiment you can do so by adding one of the following methods to the trail context manager:
Add new experiment from CLI
How to log parameters & metrics
mlflow provides autologging functionality for the following libraries:
Autologging can be enabled by calling mlflow.autolog() before the training code and it captures all available parameters, metrics and metadata.
If you want to log parameters and metrics manually, you can do so by using the following functions:
- log a metric:
- log a parameter:
How to log artifacts
You can choose either of the following methods to log artifacts:
-
log an artifact with mlflow:
-
log an artifact with trail:
How to log source code
- log folder from python
- log folder from CLI
- log file from CLI
Further logging functions
- add a hypothesis: